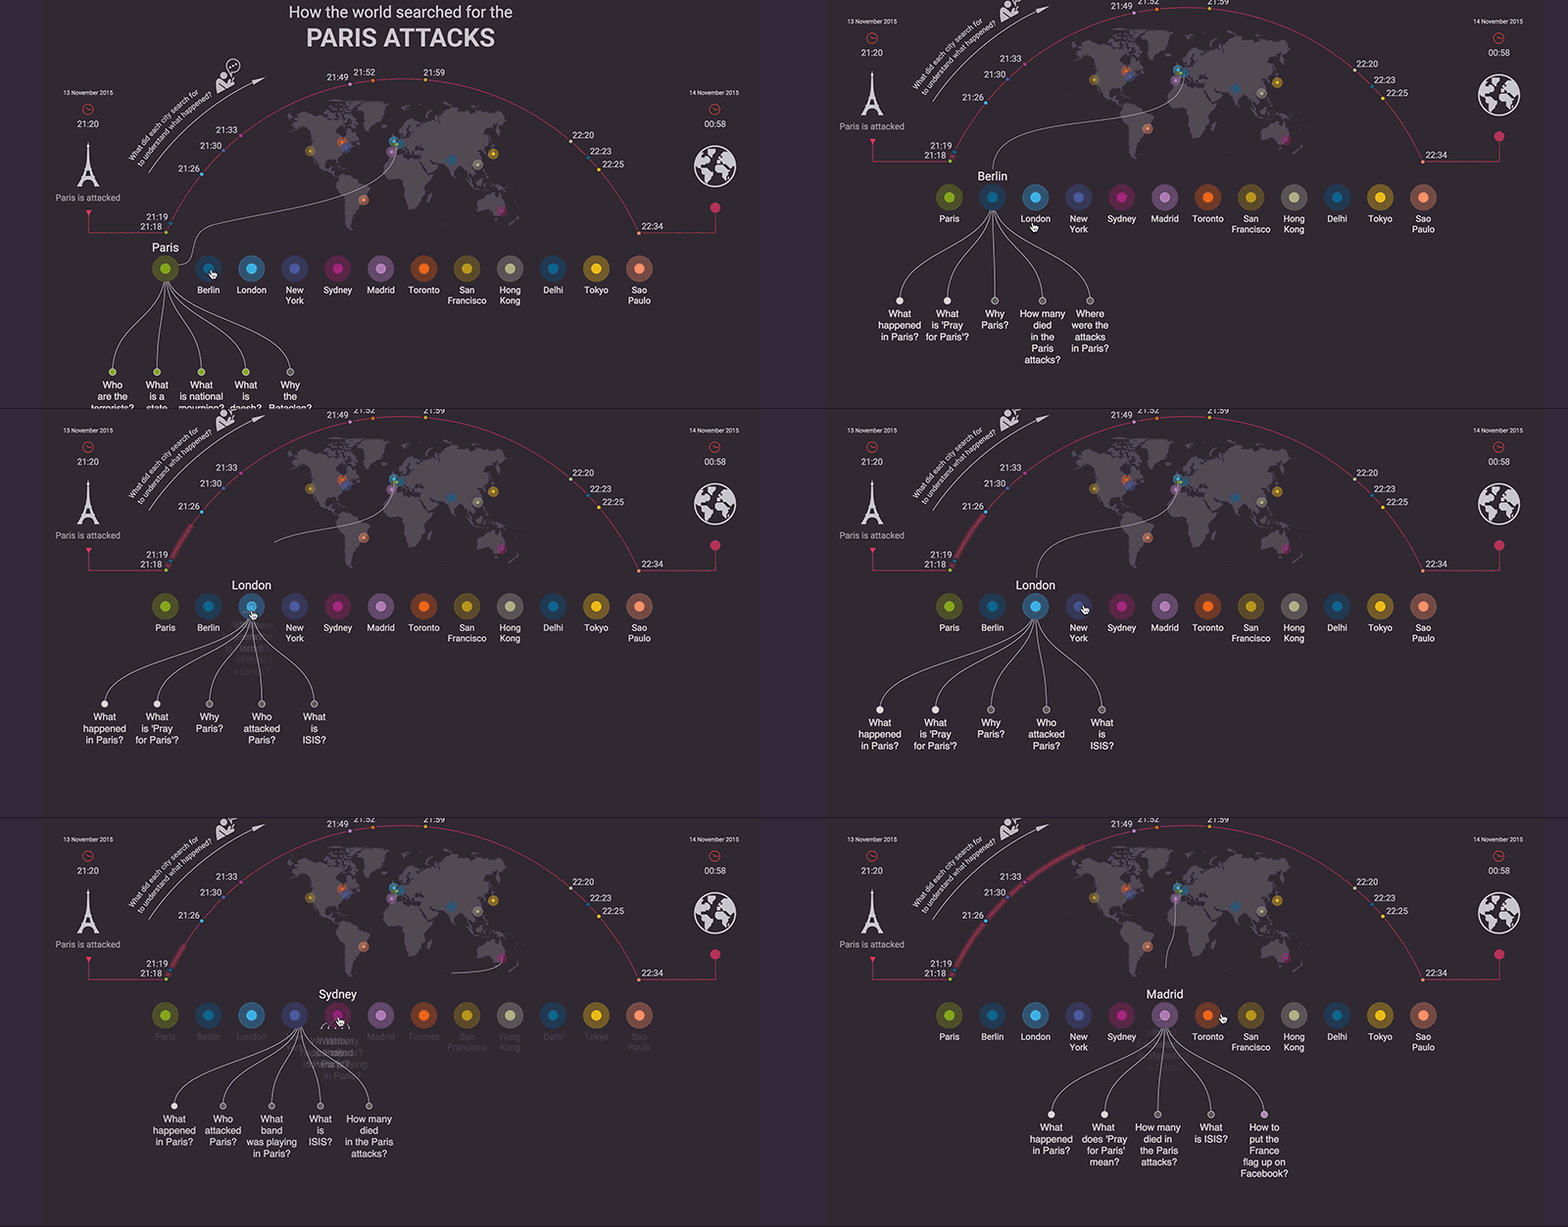
This is an interactive visualization showing how different cities searched to find out what happend in Paris on Nov 13th.
Tech: JavaScript, D3.js, SVG, CSS animation, SpreadSheets
Scope: development, information design
Design elements
Each of the 12 circles represents a city color-coded to tie together its location on the world map, the time on the timeline, and the questions asked by each city. The questions are represented as a tree appearing when a person taps on a circle. transparency “halos” around the circles are reminiscent of how information spreads. Something like radio waves spread. When a person taps on a city, the timeline is animated with a line traveling from Paris to that city.
The timeline starts at the point when Paris was attacked at 21:20 local time and ends at 00:58 when the attacks ended. By this time the news has traveled around the world which is represented by the globe icon. The icon of a person searching on their phone conveys the idea that no one expected this and everyone rushed to tried to make sense of what happened.
The high-contrast color scheme alludes to the sadness around the events punctuated with bright islands of hope as people attempted to understand, empathize, and react to the events.
Methodology
First minute searched is defined as the first minute where a related search to Paris attacks showed up, starting at 21:18 Central European Time.

Brussels attacks
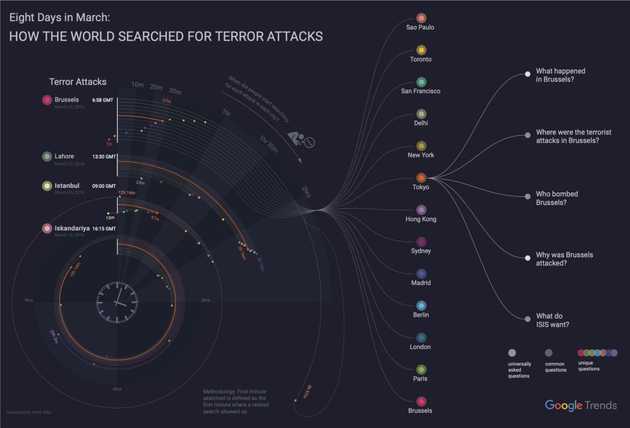
This interactive infographic shows the speed of news about four different terrorist attacks spreading from the time each attack happened to the time the news reached each of 13 large cities around the world.
The visual analogy is built around a clock that is a familiar interface for virtually all possible readers of this graphic. Most cities received the news within the first 3 hours - this is emphasized by the exploded pie chart, “exploding” a quarter of the chart. Where the news took more than 12 hours to reach a city, the time is shown as a spiral winding another circle around the clock.

