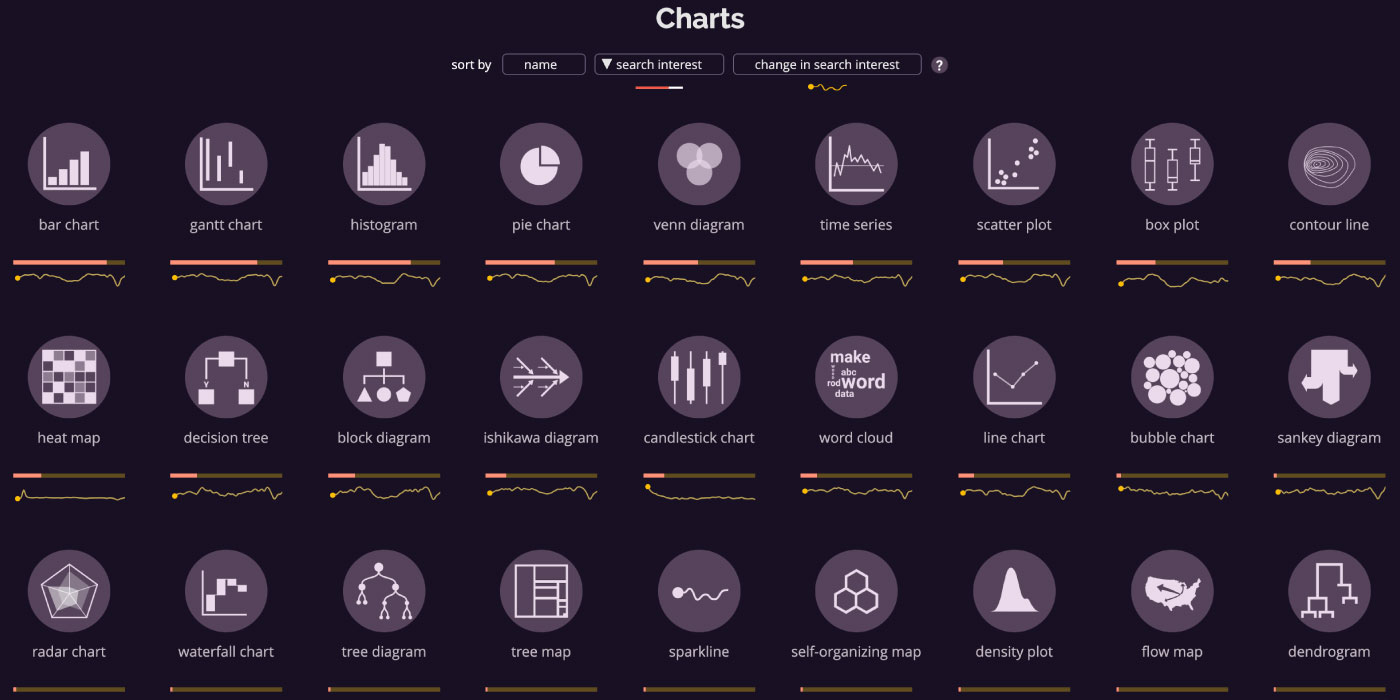
Together with a team, I developed a dashboard that shows the most popular types of charts using the Google Trends API. The dashboard app connects to Google Trends and refreshes the data daily. It’s implemented as a static site generator in Python. The frontend is built on React.js. I used D3.js to build the charts. On the backend, the data was cleaned and aggregated using Python.
Tech: Python, Google Trends API, React.js, D3.js
Scope: development, project/product management